Data Shows Take-Home Pay Is Dropping and so Are Consumers’ Work Days

Three key government-released metrics may together explain why consumers’ financial struggles may be more significant now than in previous economic downturns.
The most headline-garnering is the weekly jobless claims numbers, furnished by the Department of Labor. The department’s latest figures from Thursday (June 29) showed initial unemployment claims — typically seen as a sign of layoffs — dropping by 26,000 to 239,000. This decline followed a series of jumps in claims to numbers not since fall 2021.
The average amount of hours worked is also declining. Per the Bureau of Labor Statistics (BLS) Employment Situation release, average weekly hours gradually slipped from the most recent 35-hour high in January 2021, although not approaching the pandemic-driven low of 34.1 in March 2020.
As of 2021, 55% of workers were on an hourly pay schedule, reflecting data from the most recently released BLS report, which also noted this level was mostly unchanged from the previous year. This means that any variability in hours worked may affect over half the U.S. consumer population. While the rate of hourly consumers may shift in 2022, there’s no cause to believe this share would diminish so significantly that it wouldn’t remain a large slice of the workforce.
The weekly hours dip is partially behind the drop in real wages, representing consumer buying power. Also released by the BLS, real average hourly earnings increased 0.2% year over year in May. However, combined with a 0.9% decrease in the average workweek, consumers saw a 0.7% decline in real average weekly earnings over the same period.
Altogether, while jobless numbers seem to be inching up, the combined slowdown of hours and real earnings may be raising the rates of economic insecurity among consumers across the country. With this in mind, it’s no wonder the job market at first glance seems so weird.
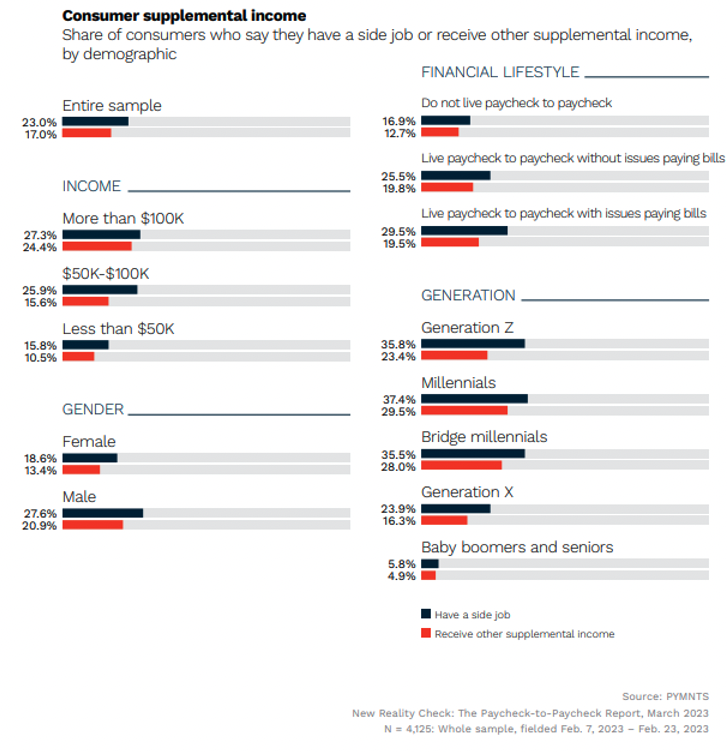
Many are seeking supplemental income to make ends meet, as illustrated in “New Reality Check: The Paycheck-to-Paycheck Report,” a PYMNTS and LendingClub collaboration.

Nearly one-quarter of surveyed consumers said they have a side job to help pay their bills, with the highest age demographics hustling in this way being millennials (37%) and Generation Z (36%). It may be no coincidence that these two generations also have the highest rates of living paycheck to paycheck, at 73% and 66%, respectively.
Why these generations, in particular, lean on second jobs or side hustles likely relates to the average pay for their ages, which ranges from 18 to 42. Per BLS data, the highest average wage for any worker in these demographics is $1,329 per week, or approximately $70,000 per year. That may not be very much when considering student debt and other obligations, so it may be no wonder that millennials and Gen Zers are looking for side jobs.
Members of Gen Z have been particularly vocal about their struggles, taking to TikTok to share their financial stumbling blocks and show off knowingly bought knock-offs. With such a high share of each generation living paycheck to paycheck, both with and without issues paying bills, these demographic segments may be particularly vulnerable to hours and real wage decreases. With no current clear end in sight for a pullback of interest rates or price tags, both generations may continue to experience financial challenges.