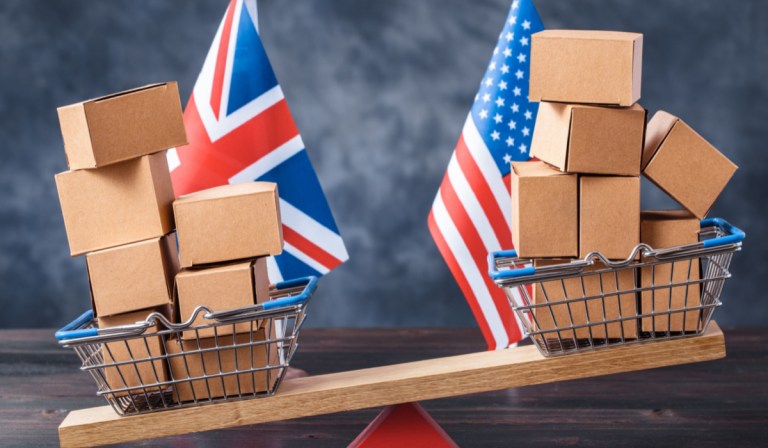
US and Britain: Two Separate Nations Now Joined by Common Digital Shopping Habits

As Americans celebrate 246 years of independence from British rule, cultural, political, and commercial ties between the two nations remain strong. One thing that continues to unite the transatlantic friends is a shared love of shopping, as the PYMNTS 2022 Global Digital Shopping Index reveals.
Compiled using data collected from 13,114 consumers and 3,100 merchants, the report calculates an Index score representing the friction associated with consumers’ purchasing experiences according to the features they rated as critical to customer satisfaction. A higher score indicates that consumers encounter less friction when shopping.
Read the report: The 2022 Global Digital Shopping Index
So, how do the two countries stack up?
U.S. Scores Higher Across the Board, but Both Countries Improved Year on Year
When calculating scores for each country, PYMNTS considered four categories: online-native, mobile-native, smartphone-assisted brick-and-mortar and brick-and-mortar.
On average, across all categories, U.S. merchants delivered more frictionless experiences to customers than their U.K. counterparts. The difference is most stark when looking at online-native commerce, where the U.K. scores 26% lower than the U.S. overall. The two countries are the closest when considering smartphone-assisted brick-and-mortar shopping, where the U.K. scores just 6.7 points lower than the U.S., a difference of 4%.
Retailers in both countries improved their average Index scores in all categories between 2020 and 2021.
How U.S. And U.K. Shoppers Use Their Smartphones
Many of the most important takeaways from the 2022 Global Shopping Report relate to the mobile transformation in consumer preferences. Whether considering pure mobile commerce or smartphone-assisted in-store shopping, in all countries studied the data suggests that mobile shopping is on the rise.
Related: 59% of UAE Shoppers Use Smartphones to Enhance Their In-Store Experience
When it comes to using smartphones to assist their in-store shopping, 39% of U.S. consumers and 35% of U.K. consumers said they do so, the two lowest rates of all countries surveyed.
But the way U.S. consumers use their mobile devices to shop diverges significantly from U.K. consumers, as does the way that shoppers perceive their mobile experiences.
In-store shoppers in the U.S. are most likely to use their smartphones to find offers and discounts, whereas their U.K. counterparts are most likely to use them to build loyalty credit.
How frictionless British and American customers perceive their hybrid shopping journeys to be also diverges greatly.
U.S. consumers who used their smartphones during their most recent in-store shopping journeys experienced the most frictionless, mobile-assisted in-store shopping experience of any nation, with American merchants earning an average Index score of 115.
Meanwhile, retailers in the U.K. with customers who used smartphones while shopping in stores recorded lower consumer Index scores than those elsewhere. What’s more, the U.K. and Australia were the only countries in the study to witness a decrease in this metric year-on-year.
Both Countries Equal in Terms of Payment Methods Offered, but Brits Are Less Satisfied With Their Options
When it comes to the types of payment methods available, the two countries sit mid-table in terms of the “usage gap” between what consumers want and what retailers offer, but the U.S. usage gap is larger than the one observed in the U.K.
Read more: Debit Cards Are US Consumers’ Favorite Payments Go-To
To put it another way, although in both nations merchants offer a similar variety of payment methods, in the U.S., 76% of shoppers reported that the last merchant with which they shopped accepted their preferred payment method, while in the U.K. this figure was just 69%.
This data suggests that U.S. consumers are more likely to shop with merchants that offer their preferred methods, while U.K. shoppers don’t take it into account so much.
Sign up here for daily updates on all of PYMNTS’ Europe, Middle East and Africa (EMEA) coverage.